Data Projects
Here are some projects I’ve done using data analysis with Excel and Python
Web Scraping Box Office Info-graph Script
September 30, 2024
I created a program that parses data from boxofficemojo.com using Python and various libraries (ex. Pandas, NumPy, PIL). The goal of this script is to automatically generate info-graphic images that are properly formatted and ready to post on various social media platforms.
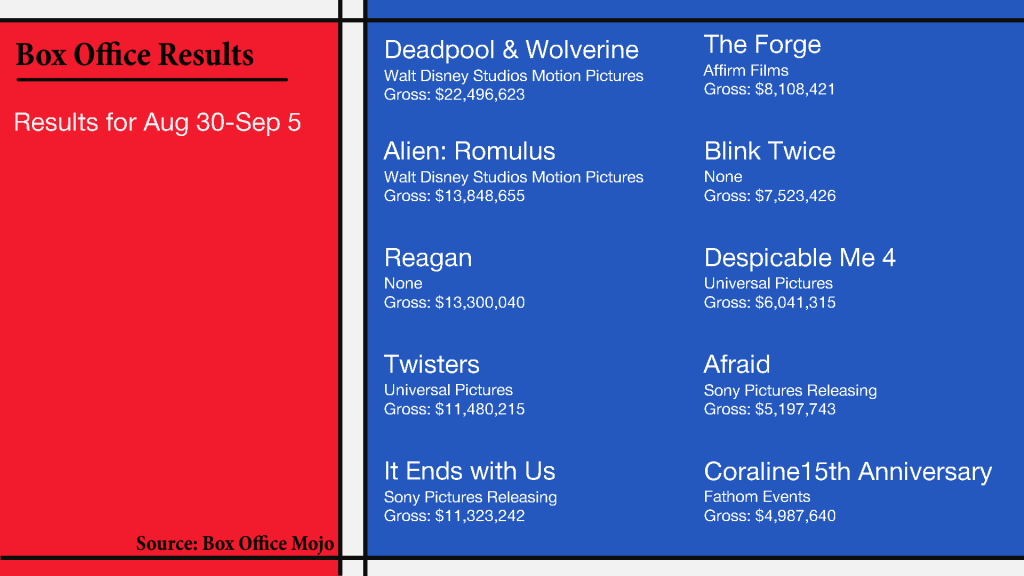
The only thing not populated by code in this image is the source label, title, and background design. Everything else, including the date in the top left and the file name itself, is generated upon execution of the Python code
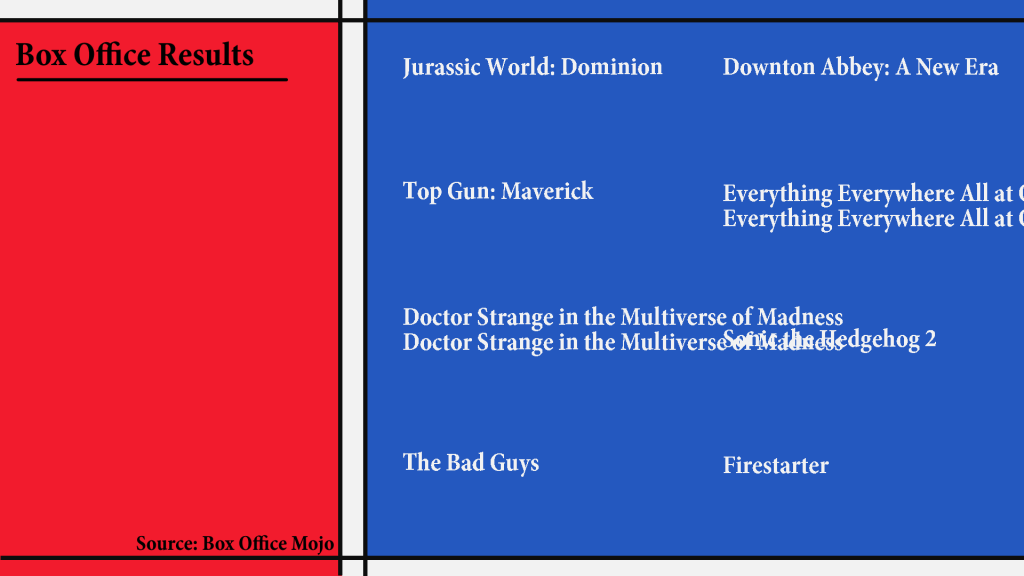
One unexpected problem was the length of movie titles. Sometimes, a title is too long and does not fit in one line. To combat this I created a rudimentary text-wrap algorithm using recursive functions that separates text based on where the last space character (” “) appears before a certain character limit per line.
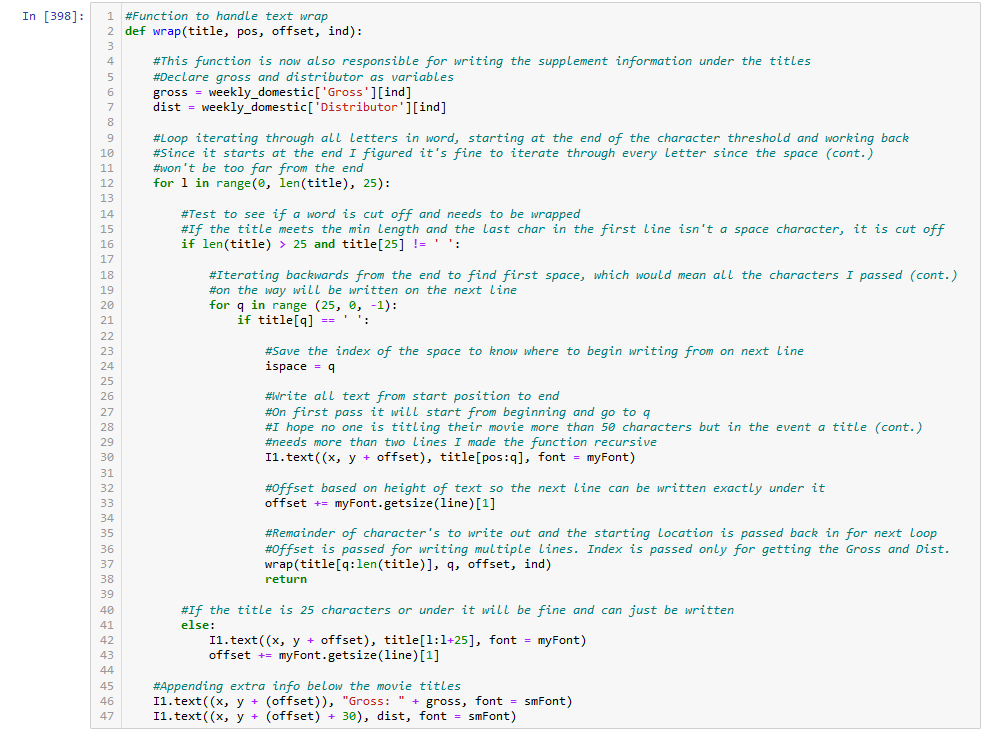
This is the function that writes the movie’s info on the picture and handles the text wrapping
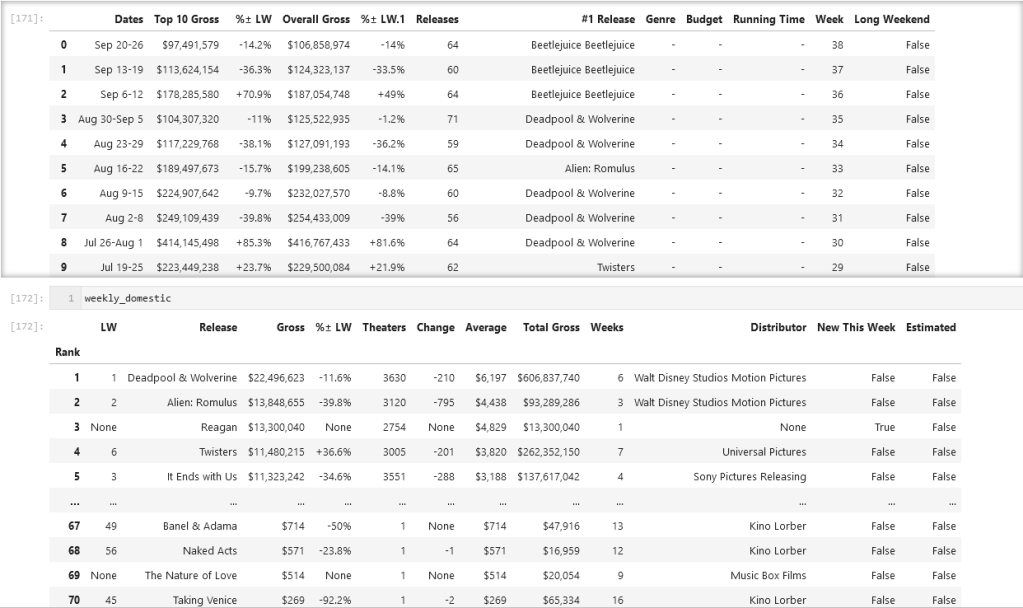
This data scraping exercise was less about the final product and was more focused on familiarizing myself with web data collection for analysis. Knowing that I can easily query online tables automatically will make conducting analysis much easier. Below are samples of data frames created from this experiment. The nature of this project does not require the amount of data collected but this data and methodology of acquirement will be useful in the future for other projects.
More work is required for the bot and minor aesthetic tweaks will be made but this is essentially what it is.
Movie Industry 5-Year Analysis
I lead a group of fellow students in a Data Mining class final project. The goal of this project was to analyze the top 100 movies each year over a 5-year period (2015 – 2019) to find out what the most profitable movie genres are and if there were conditions that lead to it becoming more or less profitable (such as release date, number of theaters released in, and distributor). We used advanced Python functionalities and machine learning to clean up data and create visualizations and models to help illustrate our findings.
